Network Visualisation
Want to visualise our rail network without needing any software? We have a solution!
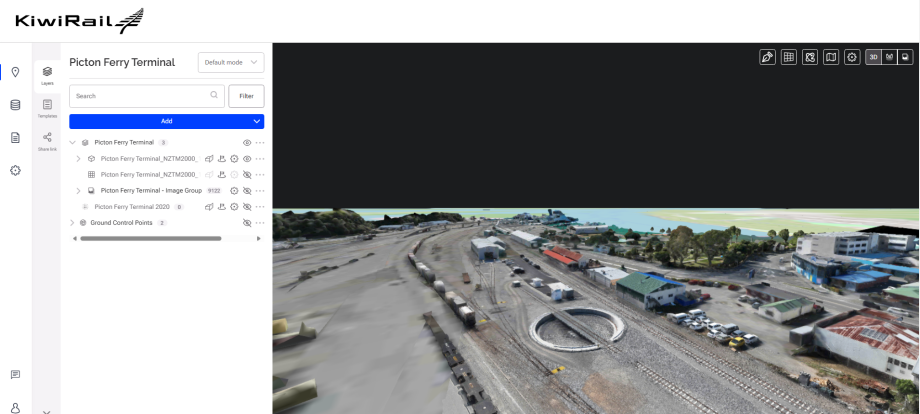
The Digital Engineering (DE) team, in collaboration with the ICT team, have been working on a solution for hosting and centralising our reality capture data and making it available to everyone - including our suppliers.
We are making this available via a platform called Skand as part of the Digital Engineering Programme.
Reality Capture Datasets
Should you require access to any of our Reality Capture datasets for project planning, analysis, or other approved purposes, please do not hesitate to contact us at drones@kiwirail.co.nz.
To help us process your request efficiently, kindly include the relevant Track Name and Kilometre Post (km post) ID, if known (e.g., NIMT Line, 37 km).
If we hold data for the area you have identified, we will provide the appropriate support and facilitate access where possible.